![]()
・All Deviation from User-Definable "OK" and "NG" Ranges
Recorded, Logged and Shown on Screen during
Real Time Measurement.
・User-Selectable Sampling Interval From 0.1 Seconds to 10 Seconds, Viewable
On Data Playback Chart.
・Click Any Point on Playback Graph For Triple Read-out: Temperature Rise/Fall,
Elapsed Time and Measured
Temperature.
・Automatically Records and Enters End-Times for Easy Comparison of Multiple
Runs.
・Zoom-In on Any Portion Of Playback Graph During Measurement.
![]()
Ver.5 Series |
|
|
Applicable OS |
Windows95/98/Me or Windows NT4.0/2000/XP |
| Maximum temperature choices | 100℃、200℃、300℃ |
| Measurement-Duration choices |
2、4、6、8 and 10 minutes. |
| Data sampling time | Readings are taken every 0.1-second interval. |
| Use Excel (or other spreadsheet) for Charting | You can choose 0.1、0.2、0.5、1、2、5、10 seconds of sampling at user's option and indicate it on the chart. And you can scroll it and print out necessary pages only. |
| Making the automatic Judgment profile | You can set 10 points of time and temperature on the table for each channel. A copy function is provided for this function. |
| Set-up the value for the automatic analysis judgment | You can set 9 items for automatic readings ("automatic judgment") using numerical value for each channel. A copy function is provided for thes function. |
| Operate the "judgment" function | Profile judgment can be used during real time and playback. Analysis value judgment can be used for playback only. |
| Designate the executive channel | During measurement, playback and print out, you can designate an executive channel. |
| Set the start time for a temperature measurement | You can set any temperature between 0〜100℃. |
| Indication for Rise/Fall Temperature Speed, Measured Temp., and Elapsed Time | While any playback channel is displayed, click any point on the Playback Graph to simultaneously display Temperature Inclination (Rise and Fall in Degrees Centigrade per second) as well as Measured Temperature and Elapsed Time from beginning of measurement. |
| Enlargement of the measurement graph | During playback, you can designate a portion of the graph for enlargement. |
| Finishing time note | When the temperature measurement has been completed, the finishing time (hour, minute and month, day and year) will be entered on the analysis chart. |
| CSV file | File name, temperature data and note can be transferred to software in the market using CSV file. |
![]()
(The computer which you provide, should be as followings)
●Installed Pentium 266MHz or higher CPU and 32MB or bigger RAM.
●DOS/V or PC98.
●At least one RS-232C port has to be provided.
●One 3.5 inches Floppy Disk and one HHD (Storage capacity : 10MB or more).
●The color printer (Applicable to A4 Length or longer size paper.) .
●Operating System should be Windows 95/98/Me or Windows NT4.0/2000/XP
and other application software work correctly.
●A track ball (mouse) has to be connected to the computer and works correctly
as a pointing device.
![]()
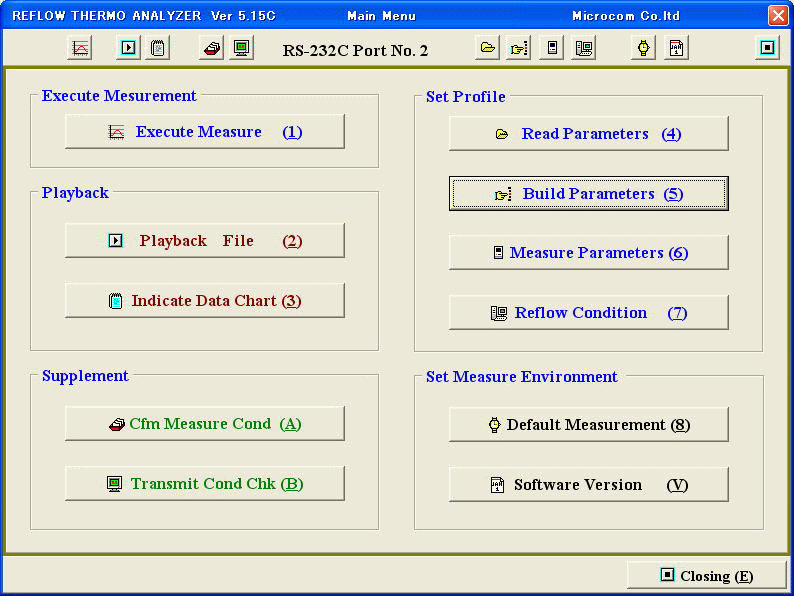
When the application software is activated, the "Main Menu" window will look like this :
(Put the picture of "Main Menu" window in here.)