Click the "Playback File (2)" key on the "Main Menu".
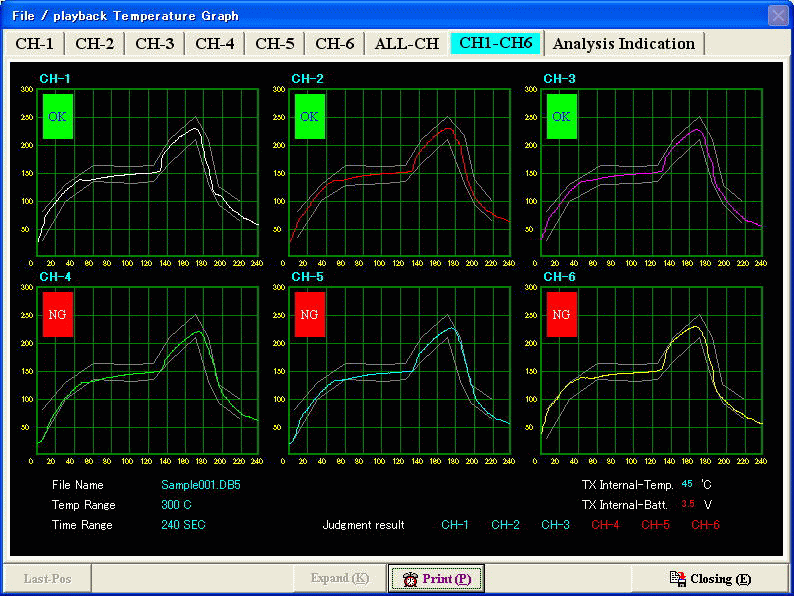
・Next, when clicking the file name that you want to use, the Multi-window
will be Shown. If you press any Channel Select key located at the
top of the Multi-Window, you will see the selected channel only.
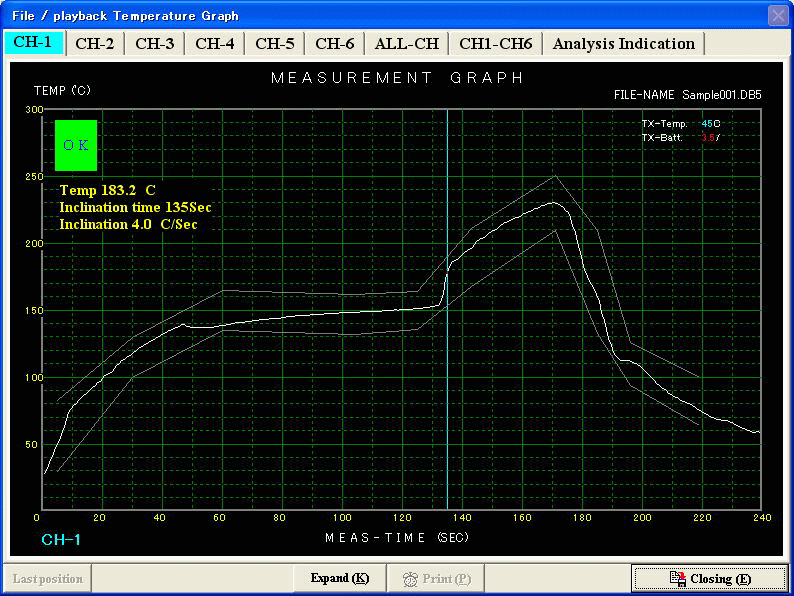
・When Displaying Individual Channels: Right-Button Clicking any point on the graph displays three elements: Temperature Inclination
(rise and fall) , Elapsed Time (from the beginning of measurement) and
Measured Temperature. And, you can enter the Temperature
Inclination (rise and fall) and Elapsed Time into the analysis chart.
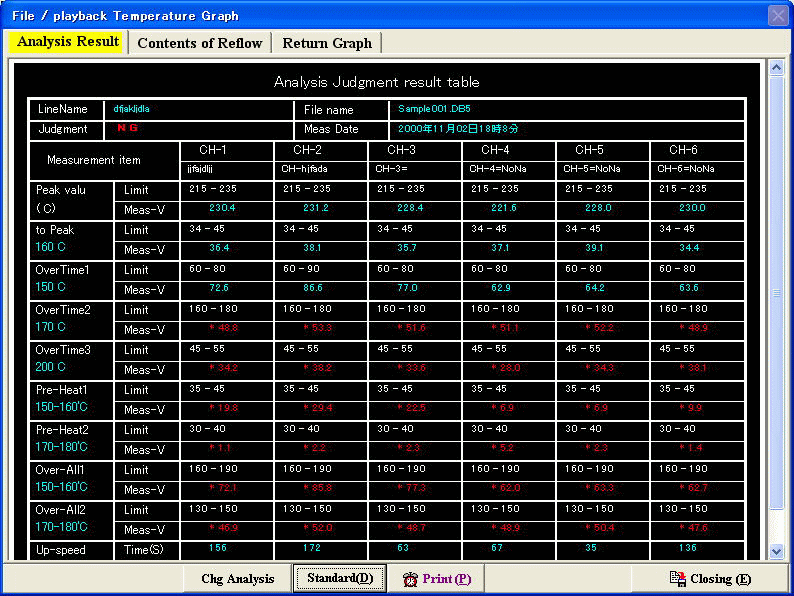
・The Stop-Time (hour, minute and month, day and year) will be automatically
entered on the result chart of the reading analysis.
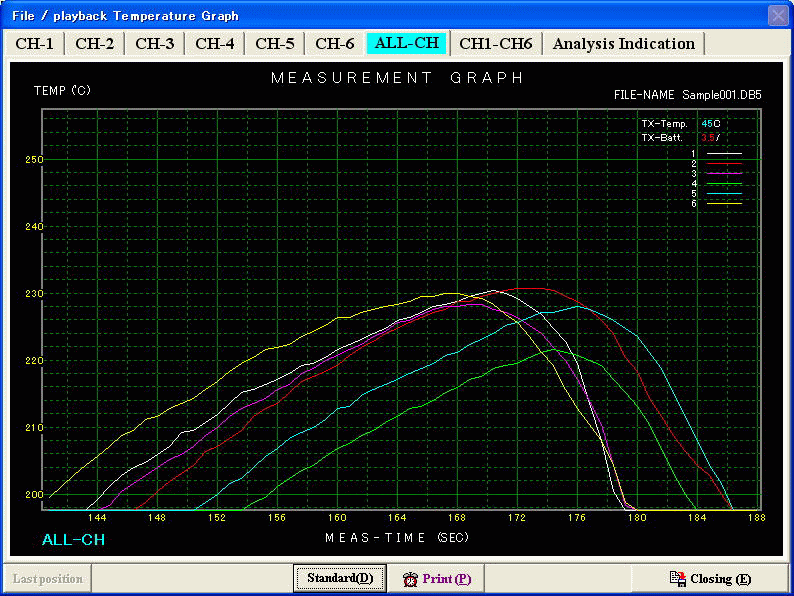
・Zoom-In on any portion of the graph by click/dragging across the area
to be enlarged.

CH1 - CH6 Playback Window

Temp., Time and Inclination Indication

Designted expansion graph.

Analysis Result